Stage 00 · The interview
Back-of-the-Envelope Estimation
The interviewer says “design a photo-sharing app” and you say “we’ll need to scale”. That’s a wish, not a design. The way to turn it into a design is to spend three minutes on arithmetic, because one or two of the numbers you compute will decide the architecture.
Take a URL shortener. You assume 100 million new URLs a month and a 10:1 read ratio, and you work it out.
100M / (30 × 86,400)  ≈ 40 writes/s          (86,400 ≈ 10^5 is the only constant worth memorising)
reads: 10 × that       ≈ 400 reads/s          ← one machine
100M × 500 B × 12 × 5 yrs ≈ 3 TB              ← one machine
Now you know something useful. This isn’t a scaling problem at all. The interesting part is key generation, and you can say so and move on. Compare that with Google Drive, where the same steps say 12,000 metadata writes a second and 2.3 GB/s inbound, and the design has to be about chunks and direct-to-S3 uploads. The estimate told you which problem you have.
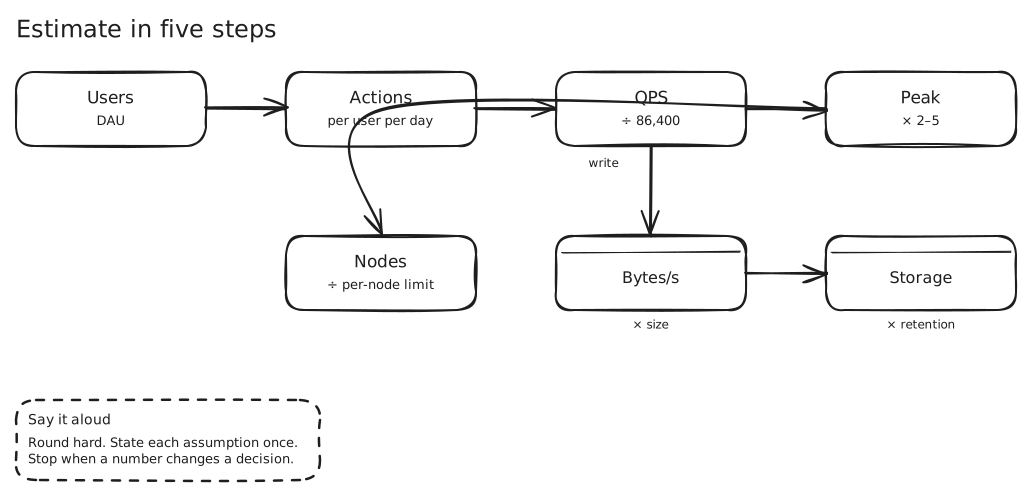
The drawing is the whole method. Users to actions to requests per second, then to peak, bytes, storage and finally a node count.
The conversions to have in your head
Time. A day is about 86,400 s, which you round to 10^5 when you’re in a hurry. A month is 2.5 million seconds, a year about 30 million.
Powers of two. 2^10 is a thousand (KB), 2^20 a million (MB), 2^30 a billion (GB), 2^40 a trillion (TB). A 64-bit id is 8 bytes; a UUID is 16.
Peak versus average. Traffic is not flat. Use 2× for a steady consumer product, 5× or more for anything with evenings, salary days or launches, and say the multiplier out loud so it’s clearly an assumption.
Read and write ratios. Most systems are read-heavy (URL shortener 17:1, Yelp mostly lurkers). A few are near even (Twitter Search reads and writes within 2×). One or two are write-heavy (Uber’s location pings, 2M/s). The ratio is often the first architectural decision.
Latency numbers that matter
These are rough orders of magnitude, in the spirit of the widely circulated “latency numbers every programmer should know” list. Memorise the shape, not the digits.
| Operation | Roughly |
|---|---|
| Read from memory | 100 ns |
| Read 1 MB sequentially from memory | tens of µs |
| SSD random read | 100 µs |
| Round trip inside a data centre | 0.5 ms |
| Read 1 MB sequentially from SSD | ~1 ms |
| Disk seek | ~10 ms |
| Cross-continent round trip | 100–150 ms |
Two rules fall out. Memory is about a thousand times faster than SSD and a hundred thousand times faster than a cross-continent call, so caches and locality matter. And a network hop inside a data centre costs about as much as thousands of memory reads, so every extra service on a hot path shows up in p99.
Throughput per box
Order-of-magnitude capacities are what turn “requests per second” into “how many machines”. Treat these as starting assumptions and say so.
- A single well-tuned Postgres node: thousands of writes a second, tens of thousands of simple indexed reads. That’s why 4,000 reads/s doesn’t force sharding, and 2 million writes/s does. → SQL Databases
- One Redis instance: on the order of 100,000 simple operations a second (a rate limiter check is closer to 50–100k). → Redis
- One Kafka partition: tens of MB/s of appends (50+ MB/s is a common quoted figure). → Kafka
- One WebSocket server: tens of thousands of open connections, often quoted at 50–100k on tuned hardware. → Real-Time Server Push
- A network link: 1 Gbps is about 125 MB/s. 200 MB/s of egress already needs a fleet.
What to compute, and what to skip
Compute the numbers that change a decision: is it one machine or many, memory or disk, read-optimised or write-optimised, storage-bound or throughput-bound? Skip the rest.
The URL shortener decided “small: focus on key allocation”. PasteBin looked identical until you multiplied by 100 KB and found 380 MB/s of reads, which meant a CDN and pre-signed uploads. Uber is small in storage (500 MB of latest driver positions) and huge in writes. Yelp is 100 GB and 350 QPS, so it isn’t sharded. A rate limiter has 10 GB of data but a million checks a second, so the operation rate forces the shards.
That last kind of contrast is the reason to do this at all. If your estimate never changes a box on the diagram, stop.
In an interview
State assumptions once, round aggressively (86,400 becomes 100,000), and label every guess as a guess. Interviewers care far more that you know which number matters than that the third digit is right.
If the source numbers are internally inconsistent (Google Drive’s 200 PB versus 200 KB), say so out loud and pick the self-consistent one. Catching that is a good signal.
The trap is computing everything. A page of arithmetic that changes nothing costs minutes you need later.
Seen in
- URL Shortener — 228 writes/s, 3,805 reads/s and 48 TB: storage forces sharding, not load
- PasteBin — the 100 KB blob multiplies bytes, not requests
- Uber — 2M writes/s against 500 MB of data
- Rate Limiter — the data fits on one box, the operation rate does not
- Google Drive — checking the arithmetic caught a 1,000× inconsistency
- YouTube — 6 uploads a second, 87 GB/s of egress